Office of the Registrar
Dartmouth College
Office of the Registrar
6014 McNutt Hall
Hanover, NH 03755-3541
Phone: (603) 646-2246
Fax: (603) 646-2247
Email: registrar@Dartmouth.EDU
Course Assessment Student View: Faculty Report
The faculty report displays data on courses taught by a faculty member from the date the faculty member indicated as the start term when s/he opted in.
Sample Faculty Report
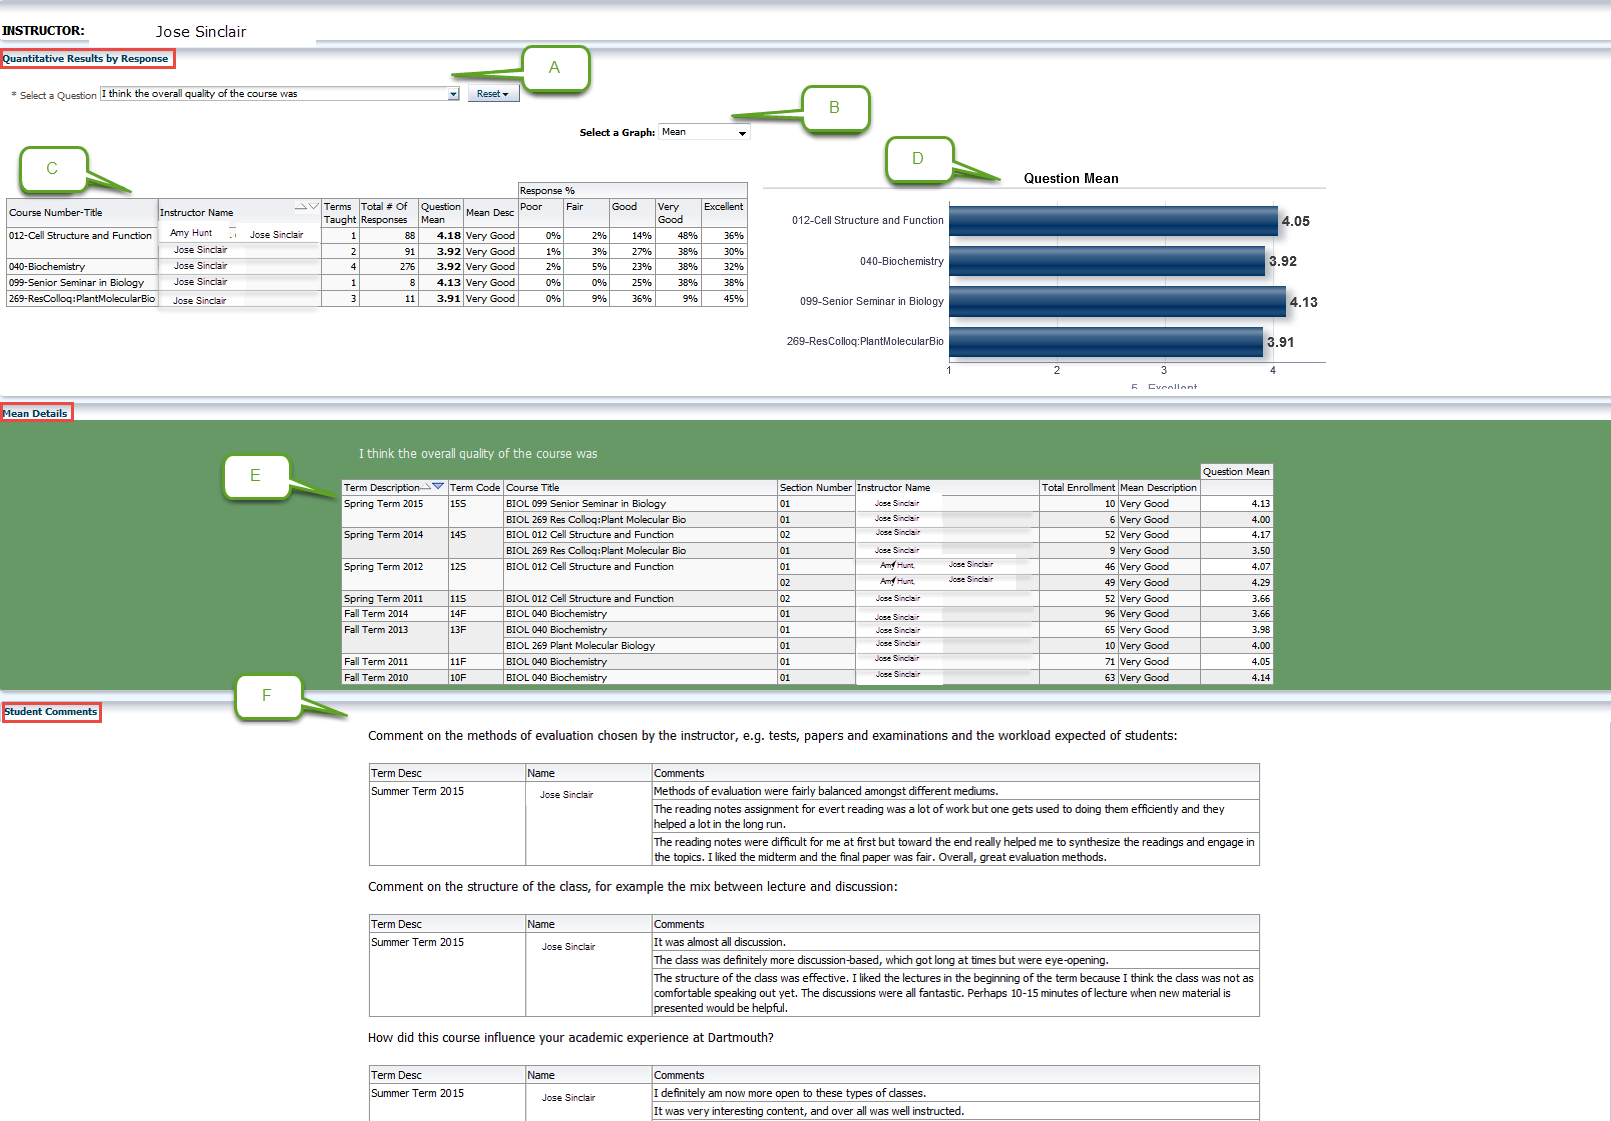

A. Select a Question – Choose the question for which you want to see data here. The questions are:
- I think the overall quality of the course was
- I put a great deal of effort into the course
- I was intellectually engaged in the course
- The objectives of the course were clear to me
- I found the course to be well organized
- The assignments reinforced my understanding of the course material
- I think the overall effectiveness of the teaching was
- The professor challenged me to think critically about the course material
B. “Select a Graph” - This option allows you to view the graphical data. There are three types of graphs: a mean graph (see D.1), a response distribution graph by % (see D.2), and a pie graph (see D.3).
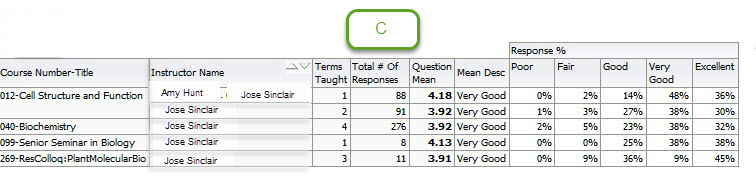
C. Data tables - Here is where you view the question response data as numbers.
- "Total Responses" indicates the total number of students who answered the selected question. This number is a total over time, so includes every time the course was available for assessment.
- "Terms taught" allows you to see how many terms a course was taught. In the above example 040-Biochemistry has been taught for four (4) terms; therefore, the mean is the average response over all four (4) terms.
- "Question Mean" indicates the mean (average) value of the responses. This number is on a scale of 1-5 with 5 as the best possible score.
- "Mean Description" provides the translation of the mean (average) numeric score to English descriptions (which correlate to the categories you saw while completing assessments) – "good," very good," etc.
- "Response %" - this set of data displays the response distribution across categories. This allows you to see, for example, that 040-Biochemistry had 276 students complete the assessments, and 45% of them responded with "Excellent."
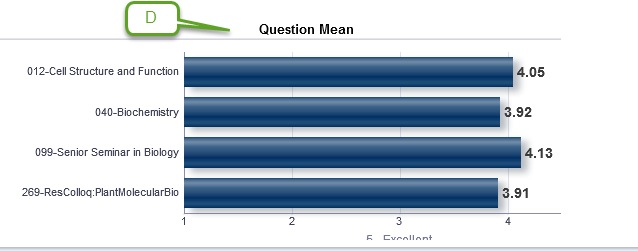
D.1. Question Mean Graph - This graph displays the mean (average) of each course taught by the same faculty member.
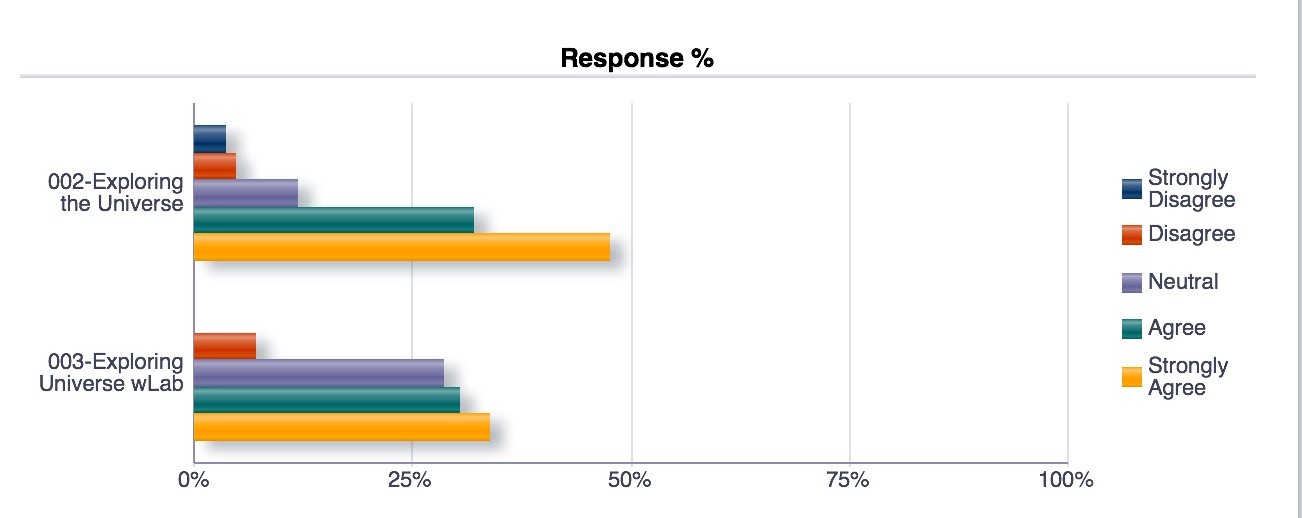
D.2. Response Category Distribution bar graph. Each course will graphically display what percentage of total responses were given per category. 002-Exploring the University had nearly 45% (You will be able to hover over the bars to get the exact number). The largest number of students selected "Strongly Agree".
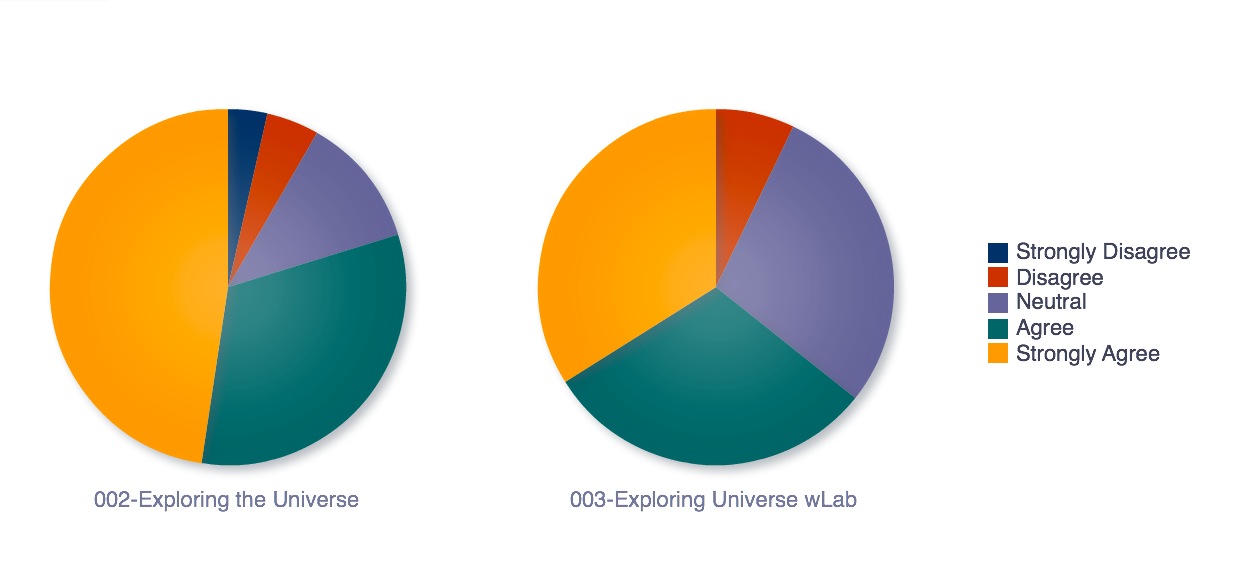
D.3. Response Category Pie graph. Each course will graphically display what percentage of total responses were given per category. 002-Exploring the university had nearly 45% (hover over the bars to get the exact number) students select "Strongly Agree".

E. The mean "details" section of the report provides more detailed data in a table format. Data is broken out by term providing both a historical view the course and the opportunity to view trends in the data.
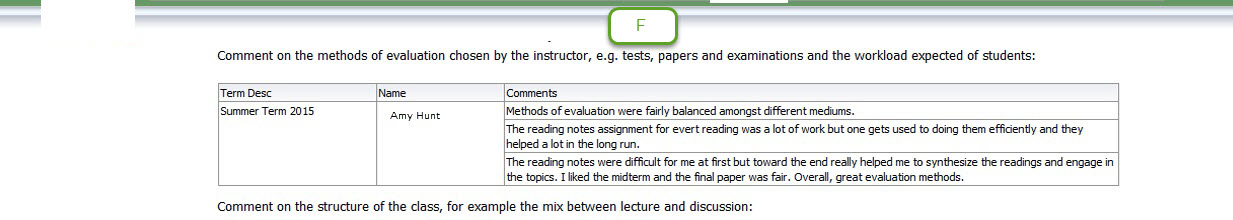
F. Student Comments – This section displays all the responses to the student-initiated questions in the assessments. These are the reactions and views of your peers.
- Comment on the methods of evaluation chosen by the instructor, e.g. tests, papers, and examinations and the workload expected of students
- Comment on the structure of the class, for example the mix between lecture and discussion
- How did this course influence your academic experience at Dartmouth?
